
Quarterly Beauty Packaging Landed Cost Index
The Quarterly Beauty Packaging Landed Cost Index breaks down tariffs, freight, material pricing, and MOQ dynamics shaping cosmetic packaging costs in mid-2026.
Packaging cost volatility is not a one-time sourcing hurdle. It is a business metric that beauty brands need to monitor with the same discipline as customer acquisition cost or inventory turnover. The price of a 30ml glass dropper bottle or an airless pump does not end when it leaves the factory floor. By the time that component reaches a fulfillment center, its true cost has been shaped by ocean freight spot rates, shifting tariff policies, raw material commodity pricing, and minimum order quantity thresholds.
For founders and procurement teams, tracking these variables is essential for protecting margins. The Quarterly Beauty Packaging Landed Cost Index provides a structured framework to measure and forecast the true cost of primary packaging. This report breaks down the cost drivers across packaging families, sourcing paths, materials, and logistics factors, offering a clear view of the current landscape in mid-2026.
The Packfolio Landed Cost Framework
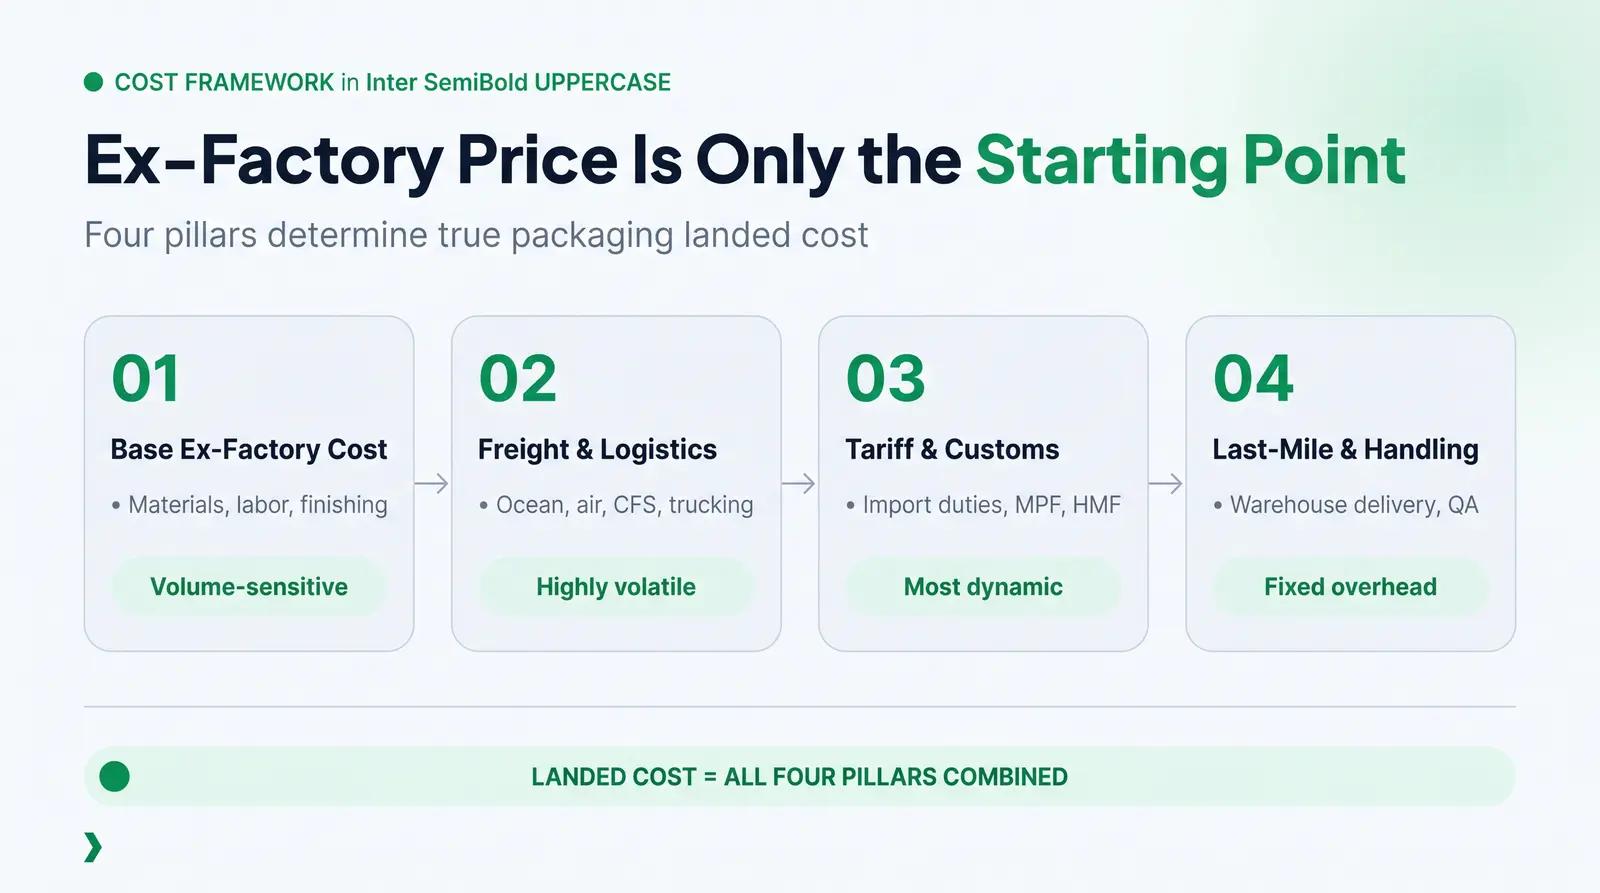
To understand packaging economics, brands must move beyond the ex-factory unit price. The true cost of packaging is the landed cost: every expense incurred to deliver the component to its final destination. The Packfolio Landed Cost Framework breaks this down into four core pillars.
The first pillar is the Base Ex-Factory Cost, which represents the price paid to the manufacturer for the physical component, including materials, labor, and basic finishing. This cost is highly sensitive to raw material pricing, such as PET resin or aluminum, and is heavily influenced by the volume ordered.
The second pillar is the Freight and Logistics Cost, which covers transportation from the factory to the destination port or warehouse. This includes ocean or air freight rates, port handling fees, inland trucking, and container freight station (CFS) charges for less-than-container-load (LCL) shipments. Freight costs are volatile and can swing dramatically based on global shipping capacity and peak season demand.
The third pillar is the Tariff and Customs Burden, which accounts for import duties, merchandise processing fees, and harbor maintenance fees. For beauty brands importing from China, this is currently the most dynamic cost driver in the entire equation, heavily influenced by shifting trade policy.
The fourth pillar is the Last-Mile and Handling Cost, which includes final delivery to the brand's warehouse or third-party logistics (3PL) provider, as well as any unpacking or quality assurance steps required before the packaging can be filled.
By tracking these four pillars on a quarterly basis, brands can build a resilient pricing model that absorbs macroeconomic shocks rather than breaking under them.
Material Commodity Trends: Q2 2026
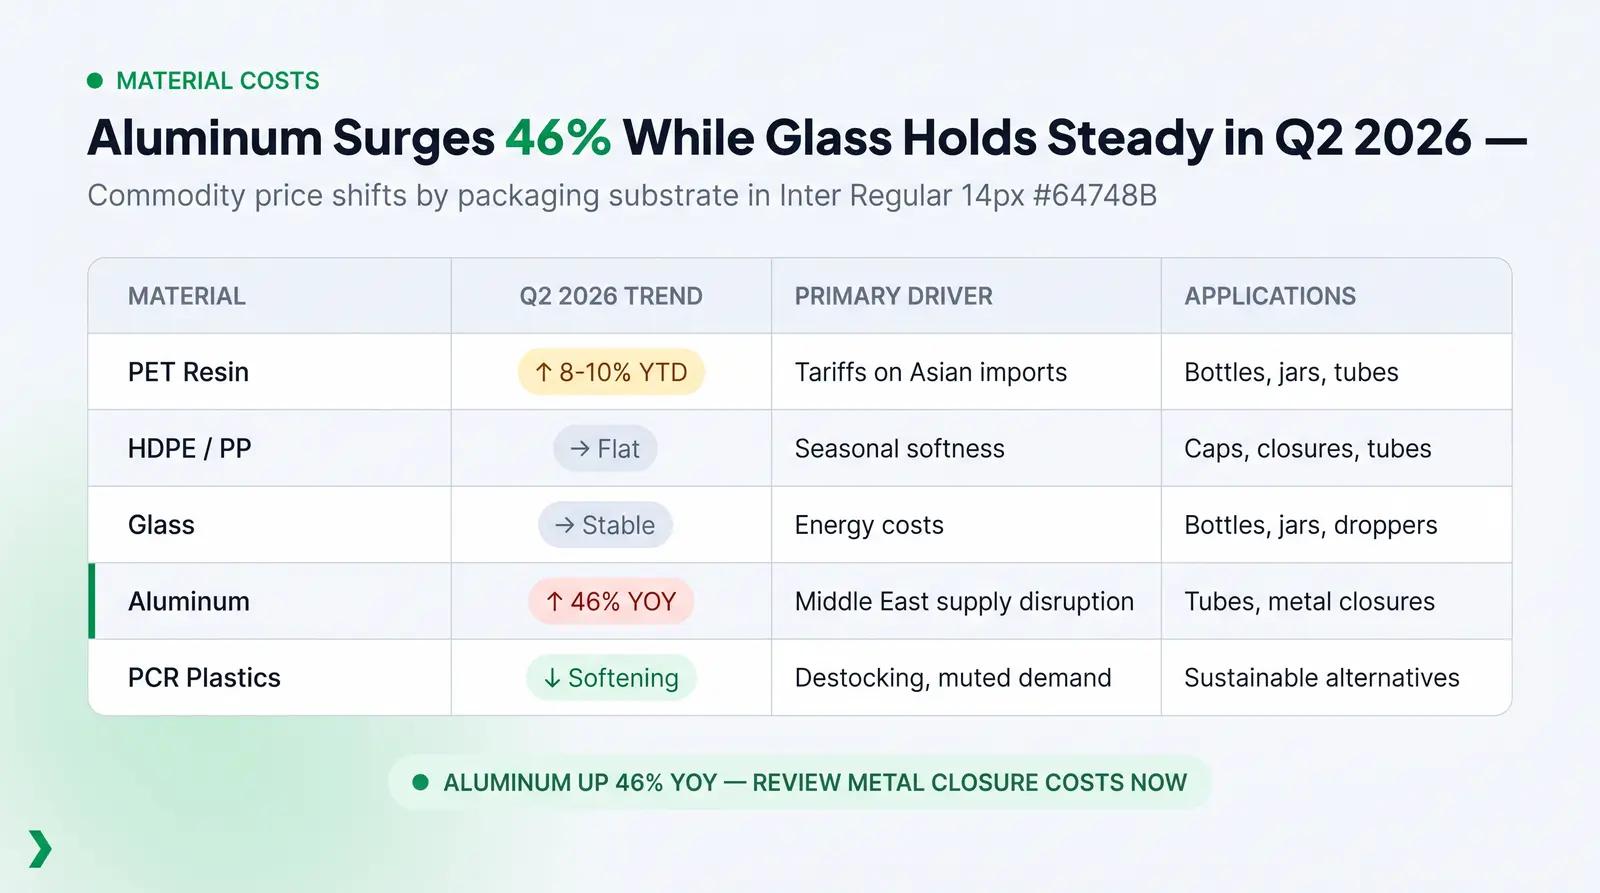
The base cost of beauty packaging is fundamentally tied to the commodity prices of its raw materials. In 2026, the material landscape is characterized by upward pressure on plastics and metals, while glass remains relatively stable but sensitive to energy costs.
Plastics and Resins
The price trajectory for major commodity resins has shifted sharply upward in 2026 [1]. Polyethylene Terephthalate (PET), a staple for lightweight beauty bottles and jars, has seen price increases driven by a combination of sluggish seasonal demand, wintertime destocking, and new tariffs on imported PET resin from Asian countries, which pushed prices up by an average of 3 cents per pound in late 2025 [2].
The post-consumer recycled (PCR) market remains complex. The U.S. PET bottle recycling rate dropped to 30.2% in 2024, and the wide price spread between domestic rPET and virgin PET continues to encourage brands to use either virgin material or inexpensive imported rPET [2]. For brands committed to sustainable packaging, securing reliable, cost-effective PCR material requires longer-term supplier relationships rather than spot-market purchasing.
Glass and Aluminum
Glass manufacturing remains a stable, albeit energy-intensive, option for premium beauty packaging. While the Producer Price Index for glass manufacturing has held relatively steady, innovations like LionGlass (developed at Penn State and now being scaled with an Italian glassmaker for luxury beauty applications) are beginning to emerge, potentially offering lower-carbon alternatives for premium brands in the near future [2].
Aluminum tells a very different story. As of June 2026, aluminum prices have surged over 46% year-over-year, reaching near four-year highs [3]. This spike is driven by supply disruptions in the Middle East, including halted exports through the Strait of Hormuz and suspended operations at major Gulf smelters, compounded by stricter controls on bauxite exports from Guinea [3]. For brands utilizing aluminum tubes or metal closures, these commodity price increases are likely to be passed down by manufacturers in the coming quarters.
The table below summarizes the current material cost pressure by packaging substrate.
| Material | Q2 2026 Trend | Primary Cost Driver | Packaging Applications |
|---|---|---|---|
| PET Resin | Up 8-10% YTD | Tariffs on Asian imports, supply imbalance | Bottles, jars, tubes |
| HDPE/PP | Flat to slightly up | Seasonal softness offsetting energy costs | Caps, closures, tubes |
| Glass | Stable | Energy costs, soda ash pricing | Bottles, jars, droppers |
| Aluminum | Up 46% YOY | Middle East supply disruptions, Guinea bauxite | Tubes, metal closures |
| PCR Plastics | Softening | Destocking, muted demand | Sustainable alternatives |
The Tariff Landscape: Navigating the 2026 Squeeze
For U.S. beauty brands, the tariff landscape in 2026 is arguably the most disruptive factor in the landed cost equation. Import duties can no longer be treated as a minor line item. They are a major cost center that dictates sourcing strategy.
The China Sourcing Penalty
China remains the dominant manufacturing hub for cosmetic packaging, offering unmatched scale, capabilities, and base unit costs. However, the tariff burden on Chinese imports has fundamentally altered the economics of this sourcing path.
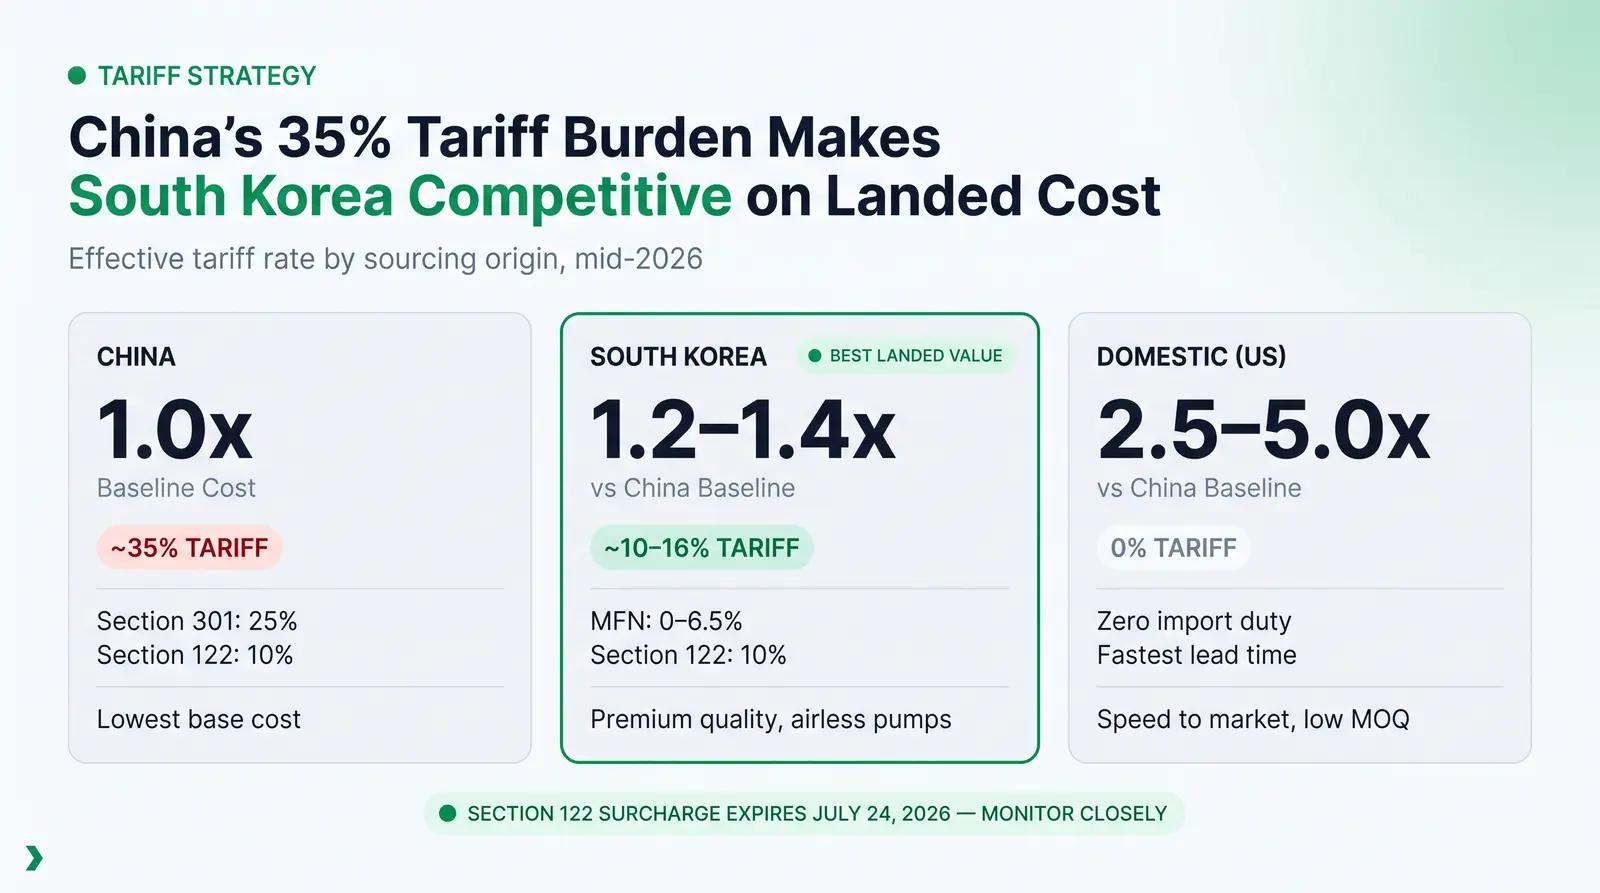
Most cosmetic packaging, including glass bottles (HTS 7010) and plastic containers (HTS 3923), is subject to Section 301 tariffs, which impose a 25% duty on goods originating from China [4]. Compounding this burden is the Section 122 global surcharge of 10%, which took effect in February 2026 and is currently set to expire on July 24, 2026 [5]. This brings the effective tariff rate for most Chinese cosmetic packaging to approximately 35%.
It is worth noting that the highly punitive IEEPA-based tariffs, which temporarily pushed rates to 145% in early 2025, were struck down by the Court of International Trade in May 2026 [5]. However, the current 35% effective rate still demands careful margin management. Brands should also monitor the July 24, 2026 expiration of the Section 122 surcharge, as the trade policy environment remains fluid.
Alternative Sourcing Paths
The heavy tariff burden on Chinese goods has accelerated the shift toward alternative sourcing hubs, with South Korea emerging as a premier destination for high-quality beauty packaging.
South Korean suppliers are globally recognized for their innovation in airless pumps, cushion compacts, and premium glass [6]. Crucially, South Korean imports are not subject to Section 301 tariffs. While they do incur the 10% Section 122 global surcharge and standard Most Favored Nation (MFN) rates (typically 0-6.5%), the total effective tariff rate is generally between 10% and 16% [6].
Although the base ex-factory cost in South Korea is often 20% to 40% higher than in China, the tariff differential can meaningfully narrow the final landed cost gap, particularly for complex or premium components like airless pump mechanisms or high-wall glass jars.
| Sourcing Origin | Typical Base Cost Index | Estimated Tariff Exposure | Key Strengths |
|---|---|---|---|
| China | 1.0x (Baseline) | ~35% (Section 301 + Section 122) | Lowest base cost, massive scale, broad capabilities |
| South Korea | 1.2x - 1.4x | ~10-16% (MFN + Section 122) | Innovation, premium quality, lower tariff burden |
| Domestic (US) | 2.5x - 5.0x | 0% | Speed to market, zero tariff risk, lower MOQs |
For brands utilizing the Packfolio catalog, the platform's vetted selection of 3D-modeled SKUs abstracts away the complexity of managing these international sourcing paths. Customers customize their artwork within predefined print zones and place an order. Packfolio coordinates production, quality assurance, and freight delivery, insulating the brand from the day-to-door logistical friction.
Freight Volatility and the LCL Trap
Ocean freight rates have experienced significant upward pressure in mid-2026. The Drewry World Container Index surged 23% in early June, with the Shanghai to Los Angeles route jumping 31% to $4,565 per 40ft container [7]. This indicates an unusually early peak season, driven by capacity constraints and early stocking behavior ahead of potential tariff changes.
For emerging beauty brands, full container loads (FCL) are rarely feasible. Instead, they rely on less-than-container-load (LCL) shipping, where cargo shares container space with other shippers. However, LCL shipping presents a unique cost trap for small packaging orders.
LCL rates from China to the U.S. West Coast currently range from $80 to $160 per cubic meter (CBM) [8]. The critical issue is that LCL shipments incur a minimum charge of 1 CBM, regardless of how small the actual cargo is [9]. When combined with origin and destination CFS fees, documentation charges, and customs clearance, the all-in minimum cost for an LCL shipment typically ranges from $300 to $500 [9].
The Contrarian Insight: When Air Freight Beats Ocean
Conventional wisdom dictates that ocean freight is always cheaper than air freight. For very small orders of dense, high-value packaging components, this is simply not true.
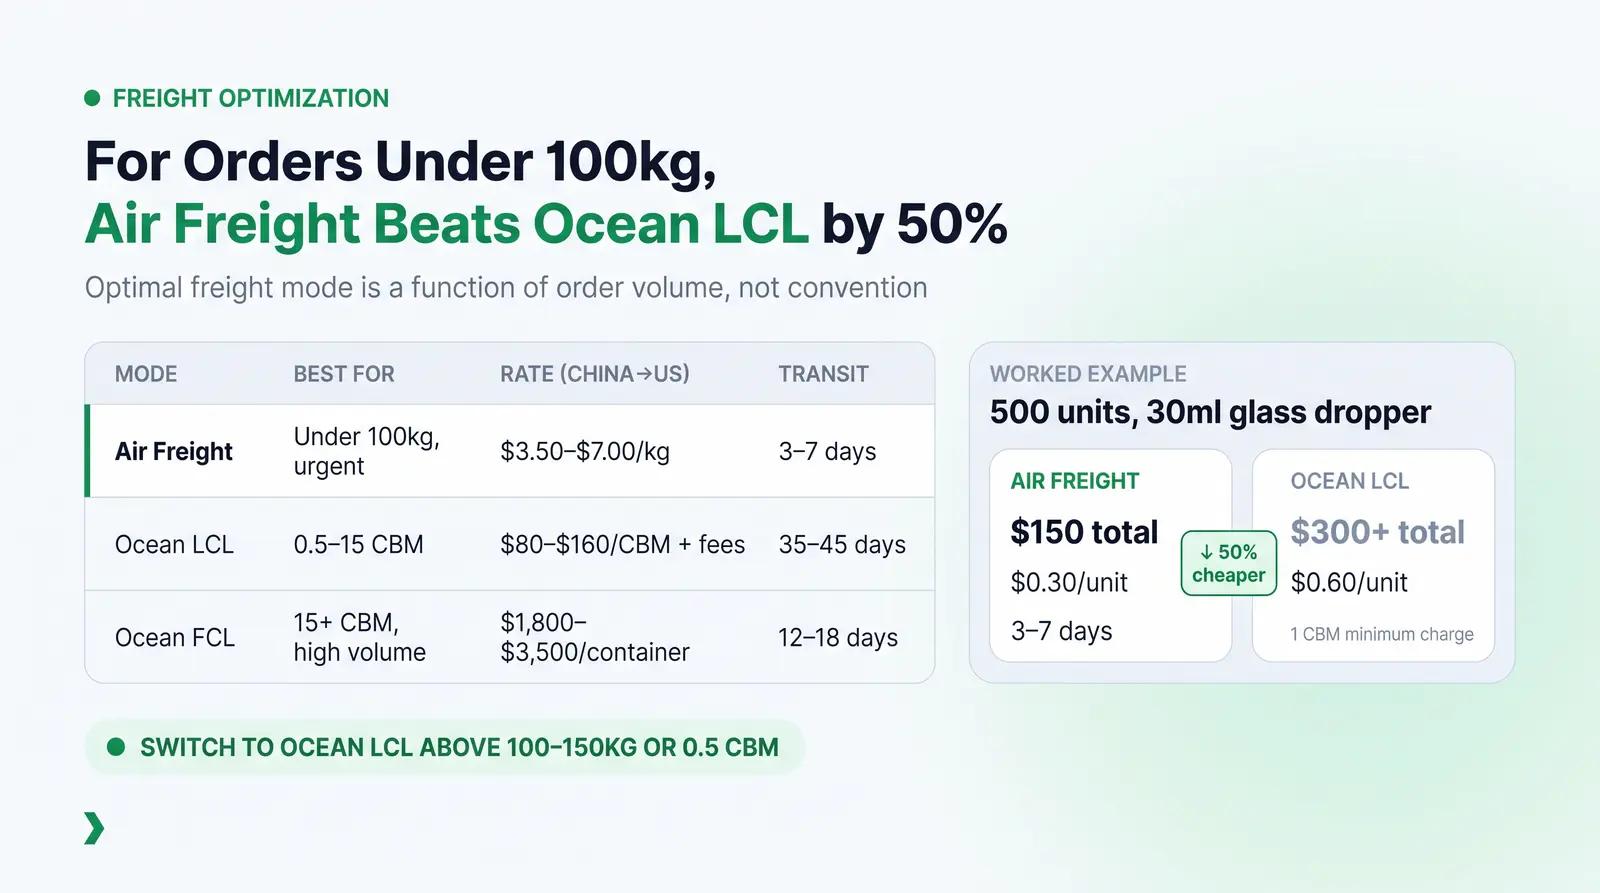
Consider a 500-unit order of 30ml glass dropper bottles. This shipment weighs approximately 30kg (66 lbs) and occupies only 0.05 CBM. If shipped via ocean LCL, the brand is hit with the 1 CBM minimum charge, resulting in a freight bill of at least $300, or $0.60 per unit.
Standard air freight from China to the U.S. currently costs between $3.50 and $7.00 per kilogram [10]. Shipping the same 30kg order via air at $5.00/kg costs $150 in total freight, or $0.30 per unit. Air freight is 50% cheaper in this scenario, and it reduces transit time from 35-45 days to just 3-7 days, lowering inventory carrying costs and accelerating speed to market.
This dynamic flips once the shipment exceeds approximately 100-150kg or 0.5 CBM, at which point ocean LCL becomes the clear cost winner [8]. The key takeaway is that the optimal freight mode is not fixed; it is a function of order volume.
| Freight Mode | Best For | Current Rate (China to US) | Transit Time |
|---|---|---|---|
| Air Freight | Under 100kg, urgent orders | $3.50-$7.00/kg all-in | 3-7 days |
| Ocean LCL | 0.5-15 CBM, non-urgent | $80-$160/CBM base (add 30-50% for fees) | 35-45 days |
| Ocean FCL (20ft) | 15+ CBM, high volume | $1,800-$3,500 per container | 12-18 days (West Coast) |
The MOQ-Band Cost Curve: A Worked Example
Minimum Order Quantities (MOQs) are the final major lever in the landed cost equation. The relationship between volume and unit cost is not linear. It follows a curve where the steepest discounts are found when moving from micro-volumes to standard minimums.
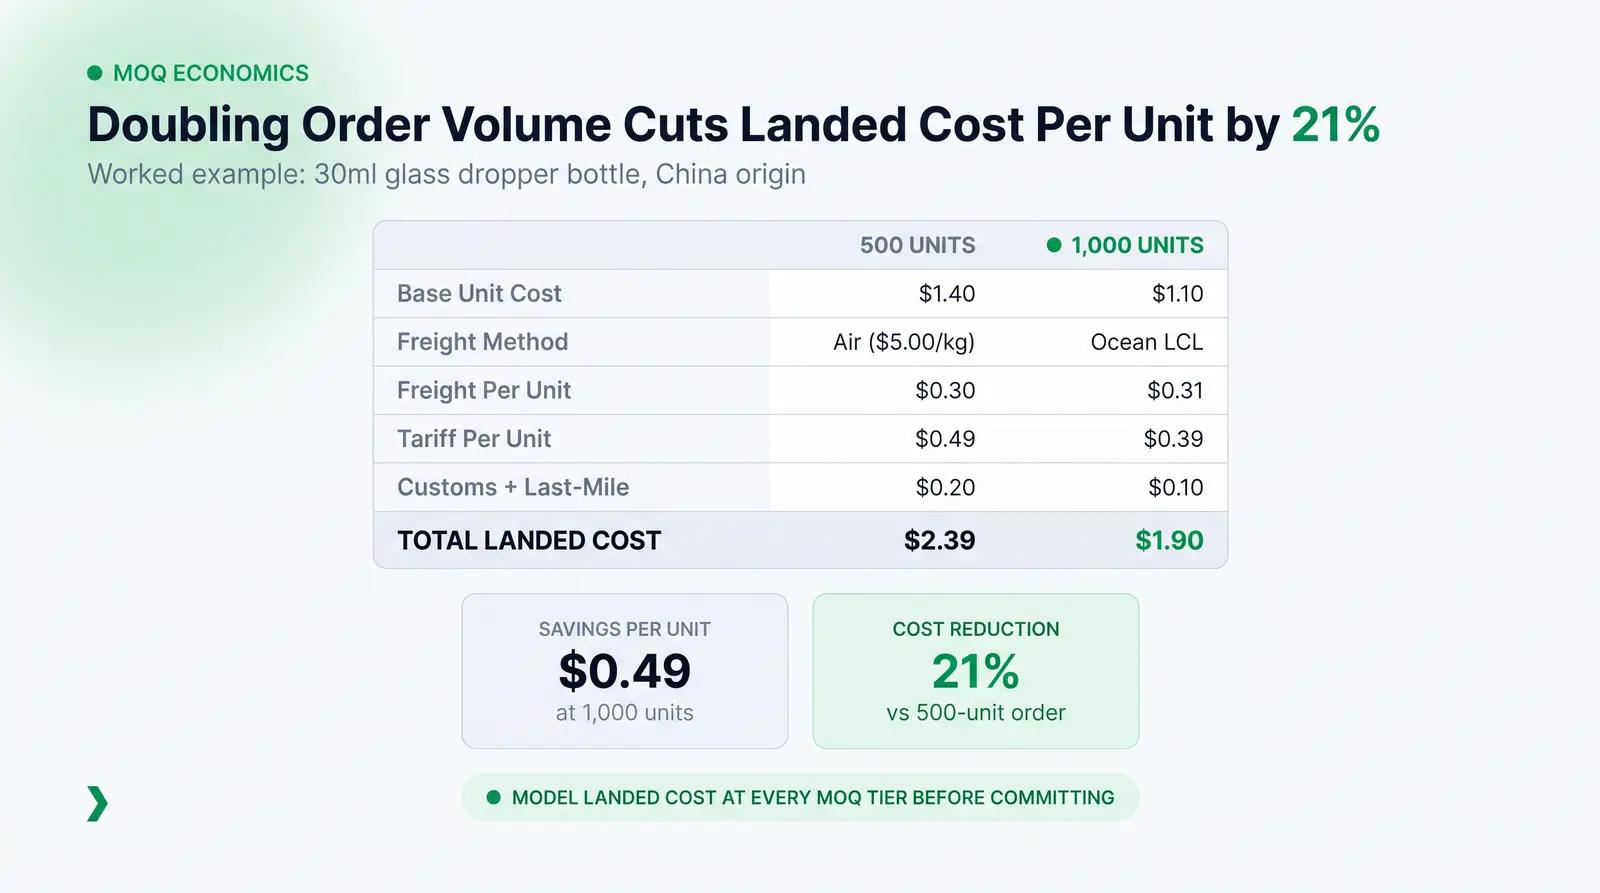
To illustrate this, here is a fully worked numerical example for a standard 30ml glass dropper bottle imported from China, comparing a 500-unit order to a 1,000-unit order.
Assumptions for this example:
Component: 30ml glass bottle with dropper assembly. Weight per unit (packaged): 60g (0.06kg). Volume per unit: 0.0001 CBM. Tariff rate: 35% (Section 301 + Section 122).
| Cost Component | 500-Unit Order | 1,000-Unit Order |
|---|---|---|
| Base Ex-Factory Unit Cost | $1.40 | $1.10 |
| Total Shipment Weight and Volume | 30kg / 0.05 CBM | 60kg / 0.10 CBM |
| Optimal Freight Method | Air Freight at $5.00/kg | Ocean LCL at $120/CBM + fees |
| Total Freight Cost | $150.00 | $312.00 |
| Freight Cost Per Unit | $0.30 | $0.31 |
| Tariff Cost Per Unit | $0.49 | $0.39 |
| Customs Brokerage and Last-Mile Per Unit | $0.20 | $0.10 |
| Total Landed Cost Per Unit | $2.39 | $1.90 |
Doubling the order volume from 500 to 1,000 units reduces the landed cost per unit by $0.49, a 21% reduction. For a 1oz (30ml) serum retailing at $35.00, packaging COGS drops from 6.8% of retail price to 5.4%. This margin expansion is achieved through lower ex-factory pricing, a shift to more efficient freight, and the dilution of fixed customs and last-mile fees across a larger unit count.
The same logic applies across the entire packaging catalog. Brands should model their landed cost at multiple MOQ tiers before committing to a sourcing decision, rather than defaulting to the lowest available minimum.
Quarterly Index Benchmarks by Packaging Family
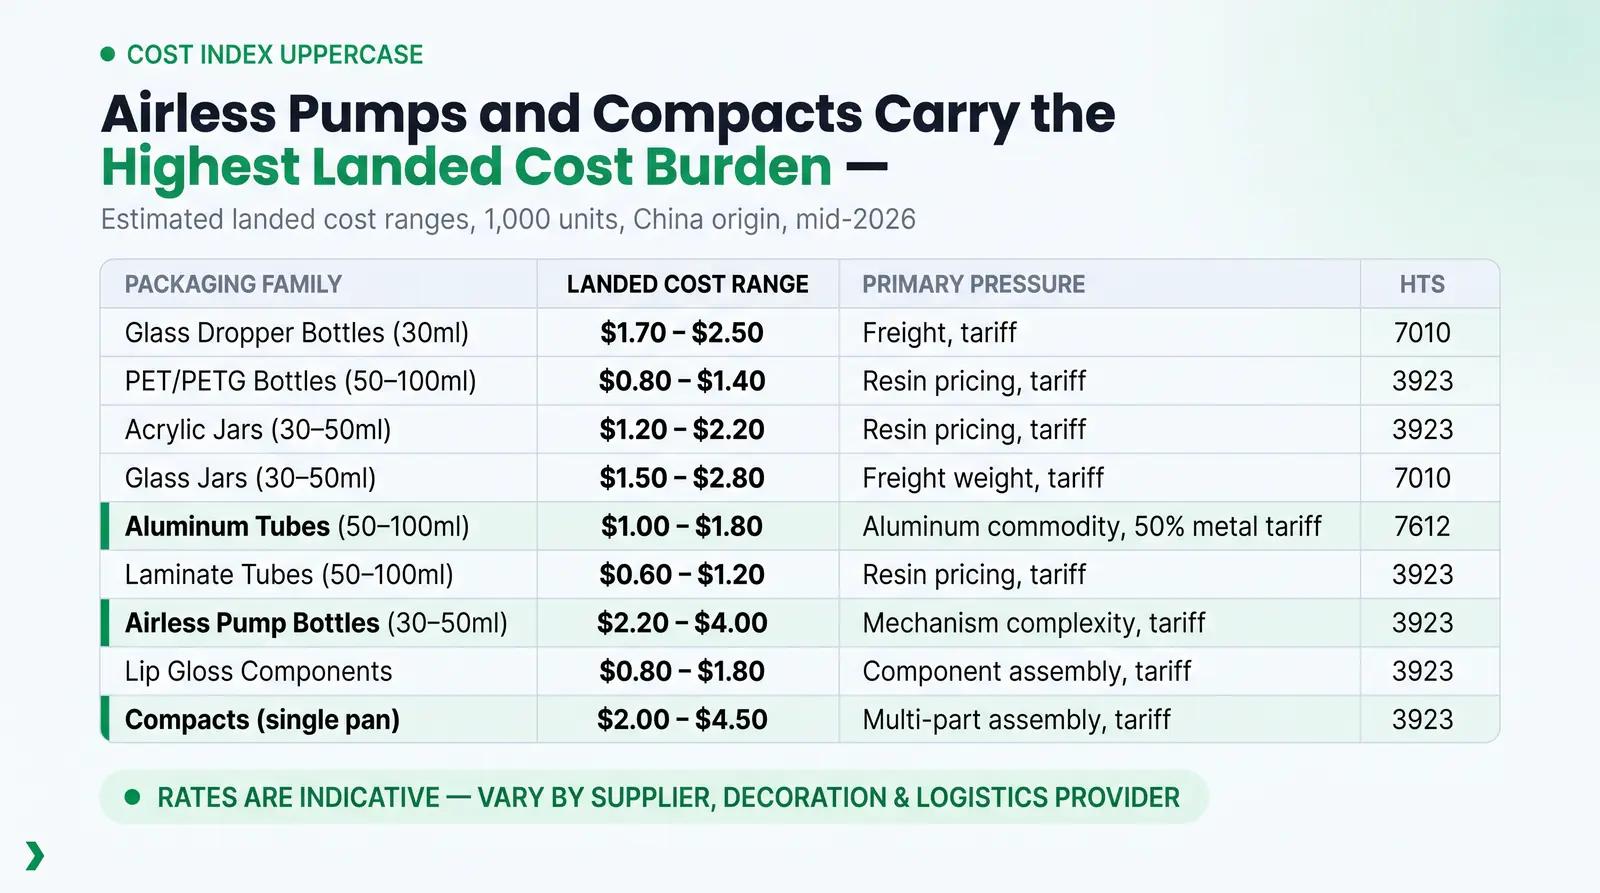
The table below provides a reference index for estimated landed cost ranges by packaging family, based on mid-2026 market conditions, assuming China origin, standard LCL freight, and a 1,000-unit order volume. These figures are indicative benchmarks and will vary based on specific supplier, decoration requirements, and logistics provider.
| Packaging Family | Unit Landed Cost Range (1,000 units) | Primary Cost Pressure | Tariff HTS Chapter |
|---|---|---|---|
| Glass Dropper Bottles (30ml) | $1.70 - $2.50 | Freight, tariff | 7010 |
| PET/PETG Bottles (50-100ml) | $0.80 - $1.40 | Resin pricing, tariff | 3923 |
| Acrylic Jars (30-50ml) | $1.20 - $2.20 | Resin pricing, tariff | 3923 |
| Glass Jars (30-50ml) | $1.50 - $2.80 | Freight weight, tariff | 7010 |
| Aluminum Tubes (50-100ml) | $1.00 - $1.80 | Aluminum commodity, 50% metal tariff | 7612 |
| Laminate Tubes (50-100ml) | $0.60 - $1.20 | Resin pricing, tariff | 3923 |
| Airless Pump Bottles (30-50ml) | $2.20 - $4.00 | Mechanism complexity, tariff | 3923 |
| Lip Gloss Components | $0.80 - $1.80 | Component assembly, tariff | 3923 |
| Compacts (single pan) | $2.00 - $4.50 | Multi-part assembly, tariff | 3923 |
Conclusion: Building Margin Resilience
The beauty packaging market in 2026 demands a proactive approach to cost management. Founders can no longer rely on static ex-factory quotes to build their financial models. Commodity prices shift quarterly, freight rates move weekly, and tariff policy can change with little notice. Treating packaging cost as a recurring metric, not a one-time sourcing decision, is the difference between a brand that absorbs these shocks and one that is blindsided by them.
By tracking the four pillars of landed cost, understanding the current tariff differential between sourcing origins, and optimizing freight mode based on order volume, brands can turn packaging procurement from a vulnerability into a competitive advantage.
Packfolio was built to make this easier. The platform's vetted catalog of cosmetic primary packaging SKUs, each pre-modeled in 3D with predefined printable regions, removes the guesswork from sourcing. Customers browse, customize artwork in the browser-based 3D design tool, preview the result on a photorealistic model, and order. Packfolio handles production, quality assurance, and freight delivery to the customer's address. There is no supplier contact, no freight negotiation, and no landed cost surprise.
Frequently Asked Questions
What is the difference between ex-factory cost and landed cost for beauty packaging? Ex-factory cost is the price paid solely for the manufacturing of the physical packaging component at the factory gate. Landed cost is the total expense required to get that component to your warehouse, including the ex-factory price, ocean or air freight, import tariffs, customs brokerage fees, and final delivery charges. For China-origin packaging in 2026, the gap between ex-factory and landed cost can be 50% to 80% of the base unit price, making landed cost the only number that matters for margin planning.
Why are tariffs on Chinese cosmetic packaging so high in 2026? Chinese cosmetic packaging is currently subject to a 25% Section 301 tariff, originally imposed as part of trade dispute remedies, plus a 10% Section 122 global surcharge that took effect in February 2026. This combined effective rate of approximately 35% applies to most cosmetic packaging HTS codes, including glass bottles (7010) and plastic containers (3923). The Section 122 surcharge is set to expire on July 24, 2026, but the underlying Section 301 tariffs remain in place.
When does it make sense to use air freight instead of ocean LCL for packaging orders? Air freight is often more cost-effective than ocean LCL for very small, dense shipments, typically those under 100kg (220 lbs) or 0.5 CBM. This is because ocean LCL shipments incur a minimum charge of 1 CBM plus fixed handling fees at both the origin and destination container freight stations, which can make ocean shipping disproportionately expensive for micro-volume orders. For orders above 150kg or 1 CBM, ocean LCL becomes the clear cost winner.
How does South Korea compare to China as a packaging sourcing origin? South Korea is a premium sourcing hub known for high-quality glass, innovative airless pumps, and cushion compact technology. While the base manufacturing cost in South Korea is typically 20% to 40% higher than in China, Korean imports are exempt from the 25% Section 301 tariff. The total effective tariff rate for Korean-origin packaging is generally between 10% and 16%, compared to approximately 35% for Chinese-origin goods. For premium or complex components, the tariff differential can make South Korea the more cost-effective choice on a landed basis.
How can a beauty brand reduce its packaging landed cost without changing suppliers? The most effective levers are consolidating orders to dilute fixed freight and customs fees across more units, optimizing carton dimensions to reduce shipping volume and avoid paying for excess air space, and timing shipments to avoid peak season freight surcharges (typically August through October). Brands should also model their landed cost at multiple MOQ tiers before placing an order, as moving from a 500-unit to a 1,000-unit order can reduce the per-unit landed cost by 20% or more, as demonstrated in the worked example above.
References
- Plastics Technology: May 2026 Price Trajectory for All Resins Shifts Sharply Upward
- Berlin Packaging: Q1 2026 Industry Update on Packaging Materials, Economic Indicators, and Freight
- Trading Economics: Aluminum Price Data, Historical Chart, and News
- Gibson Dunn: Stepping Away from the Brink - US-China Trade Deal Offers 90-Day Tariff Reduction
- Trade Compliance Resource Hub: Trump 2.0 Tariff Tracker, Updated June 3, 2026
- K-Beauty Packaging: Best Korean Beauty Packaging and Top Korea Cosmetic Packaging Suppliers
- Drewry: World Container Index Assessed by Drewry
- Rush Order: Sea Freight vs Air Freight Cost 2026 Comparison Guide
- Suaid Global: LCL Shipping Rates by Route 2026 CBM Pricing Guide
- ExFreight: Ocean Freight Rates in 2026 - Current Prices, Surcharges, and How to Save


