
Beauty Packaging Reorder Planning: When and How Much to Rebuy
Beauty brands can avoid costly stockouts and overbuying by calculating reorder points, safety stock, and MOQ breaks for every packaging SKU using proven formulas.
A beauty founder staring at an $8,000 pallet of slow-moving jars while simultaneously fielding angry emails about a sold-out hero SKU is experiencing the most painful cash-flow tension in consumer goods. Striking the balance between stockouts and overbuying is rarely a matter of instinct; it requires a cold, mathematical approach to inventory. Tying up capital in dead packaging chokes growth, but running out of a custom component mid-launch destroys revenue and retailer trust. For independent beauty brands, mastering the reorder timeline is the difference between scaling profitably and constantly putting out supply chain fires.
Why Packaging Reorder Planning Differs from Finished Goods
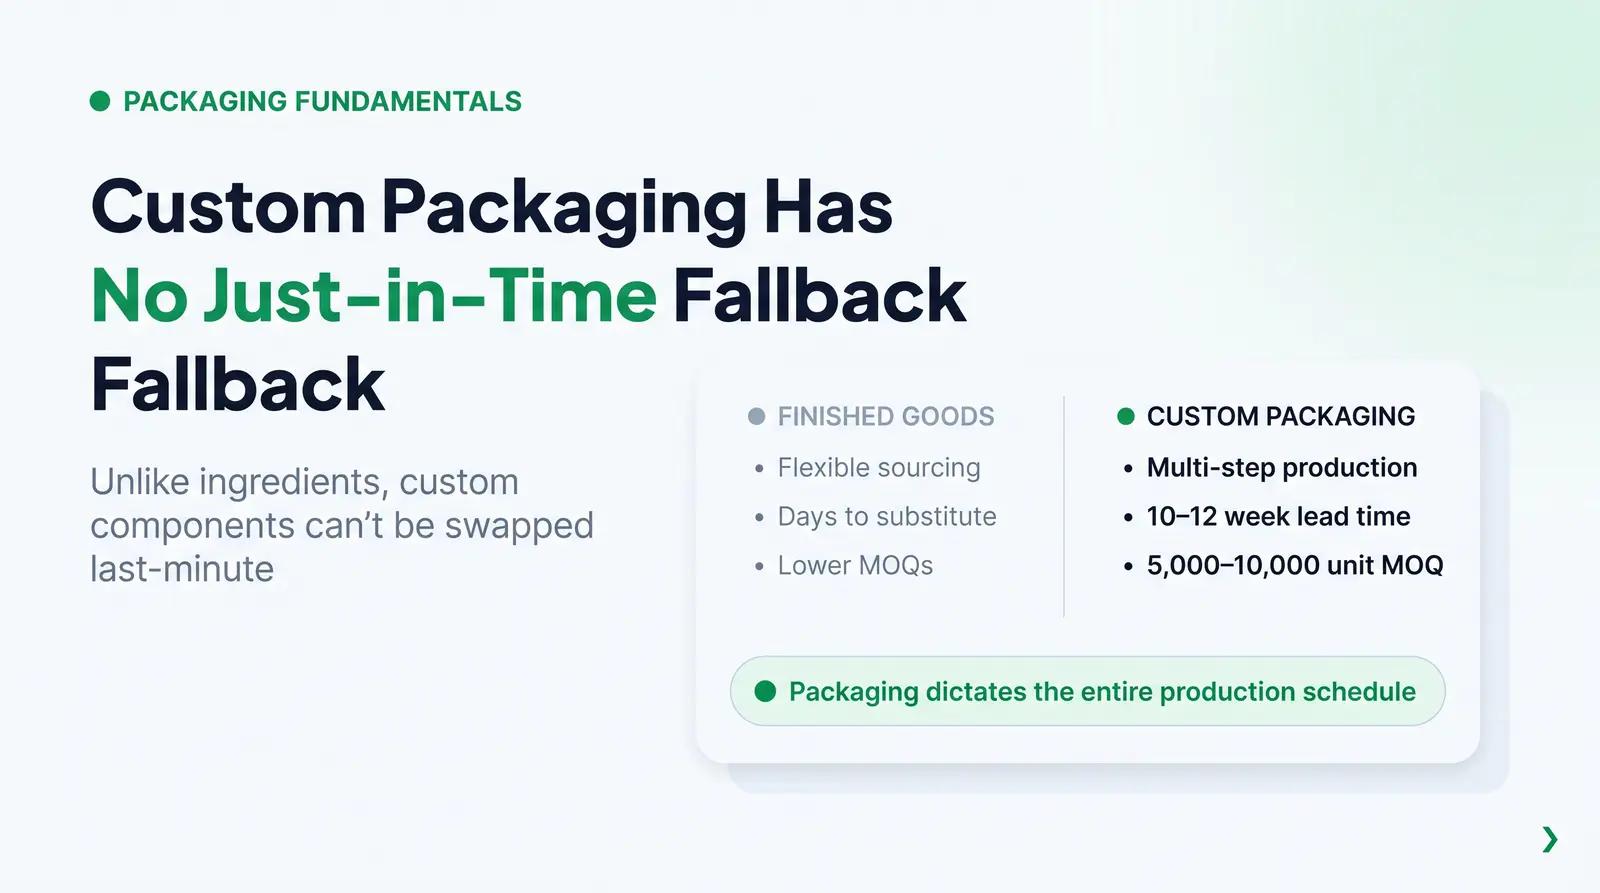
Planning inventory for cosmetic primary packaging is fundamentally different from managing finished goods or raw bulk ingredients. Packaging components carry longer lead times, higher minimum order quantities (MOQs), and far less flexibility. If a brand runs out of a specific botanical extract, a contract manufacturer can sometimes source an alternative within days. If a brand runs out of a custom-printed airless pump, there is no "just-in-time" fallback.
The production of custom packaging requires raw material sourcing, injection molding or glass blowing, decoration (like screen printing or hot stamping), and international freight [1]. This multi-step process means packaging often dictates the entire production schedule. Furthermore, while finished goods might be ordered in batches of 1,000 units, custom packaging typically requires commitments of 5,000 to 10,000 units minimum [2]. This forces founders to forecast demand months in advance and commit cash long before the product is filled and sold.
The Core Reorder Variables
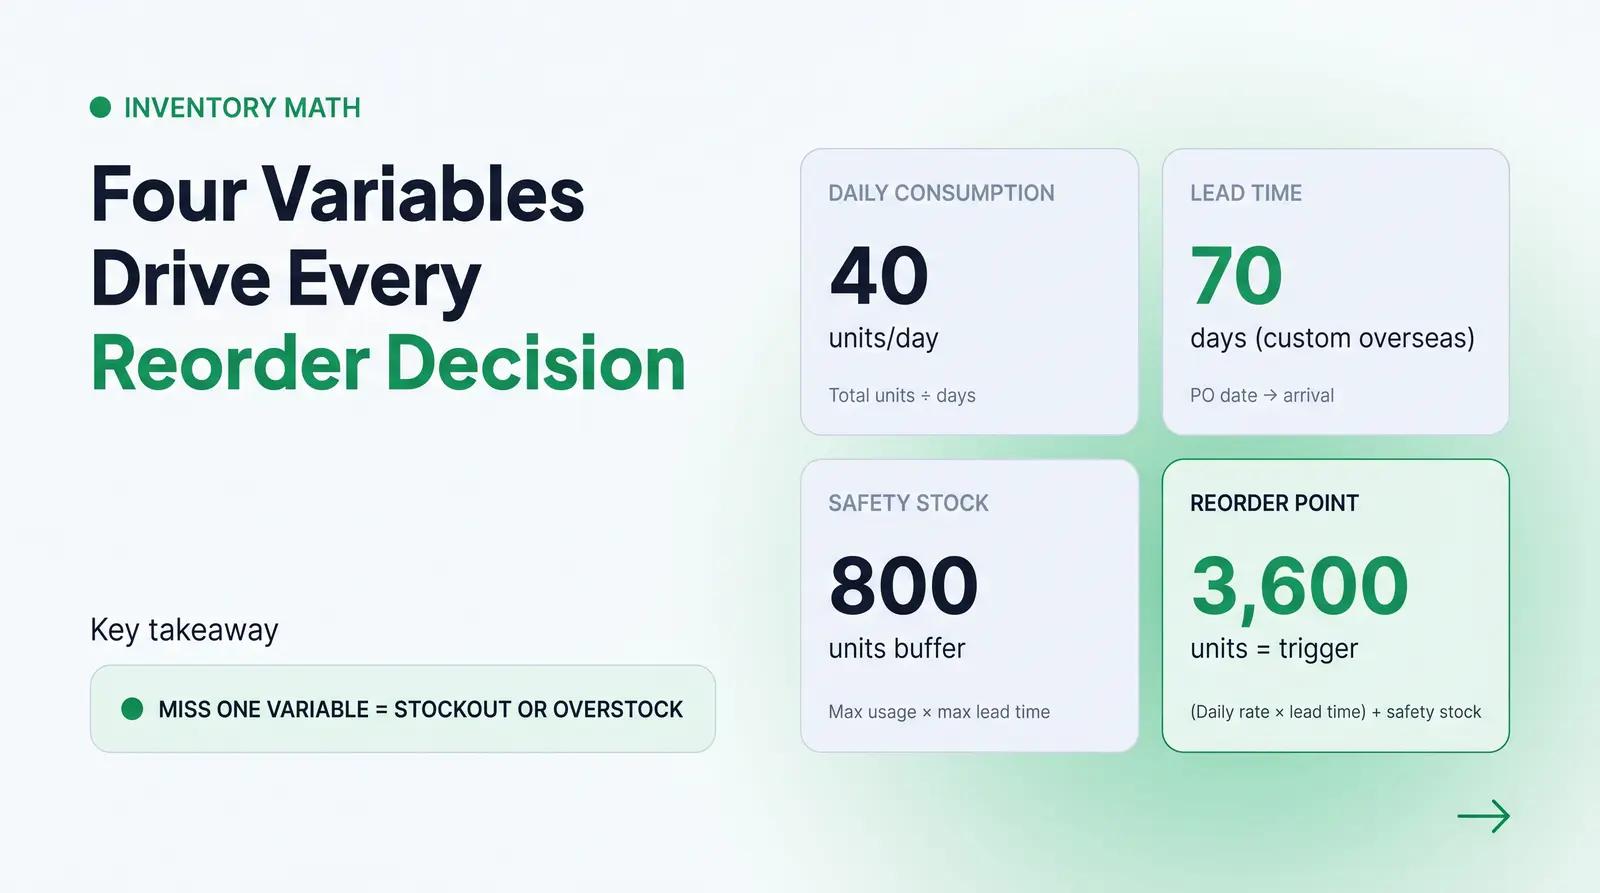
To build a reliable reorder system, founders must track four specific variables for every packaging SKU. Guesswork in any of these categories inevitably leads to stockouts or bloated warehouses.
Average Daily Unit Consumption Rate
This is the velocity at which a specific packaging component is depleted. It is calculated by taking the total units sold over a specific period (usually 30 to 90 days) and dividing by the number of days. For seasonal items or fast-growing SKUs, a weighted average that heavily favors recent weeks is more accurate than a flat annual average.
Supplier Lead Time
Lead time is the total calendar days from the moment a purchase order is submitted and paid until the packaging arrives at the filling facility [1]. It is crucial to distinguish between stock components (which might ship domestically in two weeks) and custom-printed components (which require manufacturing, decoration, and ocean freight, often taking 10 to 12 weeks).
Safety Stock
Safety stock acts as an insurance policy against unexpected demand spikes or supplier delays [3]. A standard formula for calculating safety stock is: (Maximum Daily Usage × Maximum Lead Time) − (Average Daily Usage × Average Lead Time). This buffer ensures that if a component is delayed at a port or a product goes viral, the brand does not immediately stock out.
Reorder Point (ROP)
The ROP is the exact inventory threshold that triggers a new purchase order [3]. The formula is straightforward: (Average Daily Unit Consumption Rate × Lead Time in Days) + Safety Stock. When physical inventory drops to the ROP, the reorder must be placed that day.
Economic Order Quantity (EOQ)
EOQ is a classic supply chain formula designed to find the ideal order size that minimizes both holding costs and ordering costs [4]. However, for small beauty brands, EOQ has severe limits. The formula assumes constant demand and flexible ordering sizes, but in the cosmetic packaging industry, supplier MOQs often override the EOQ calculation. If a brand's EOQ is 3,000 units but the factory's MOQ is 10,000, the EOQ is merely theoretical.
The Packaging Reorder Readiness Rubric
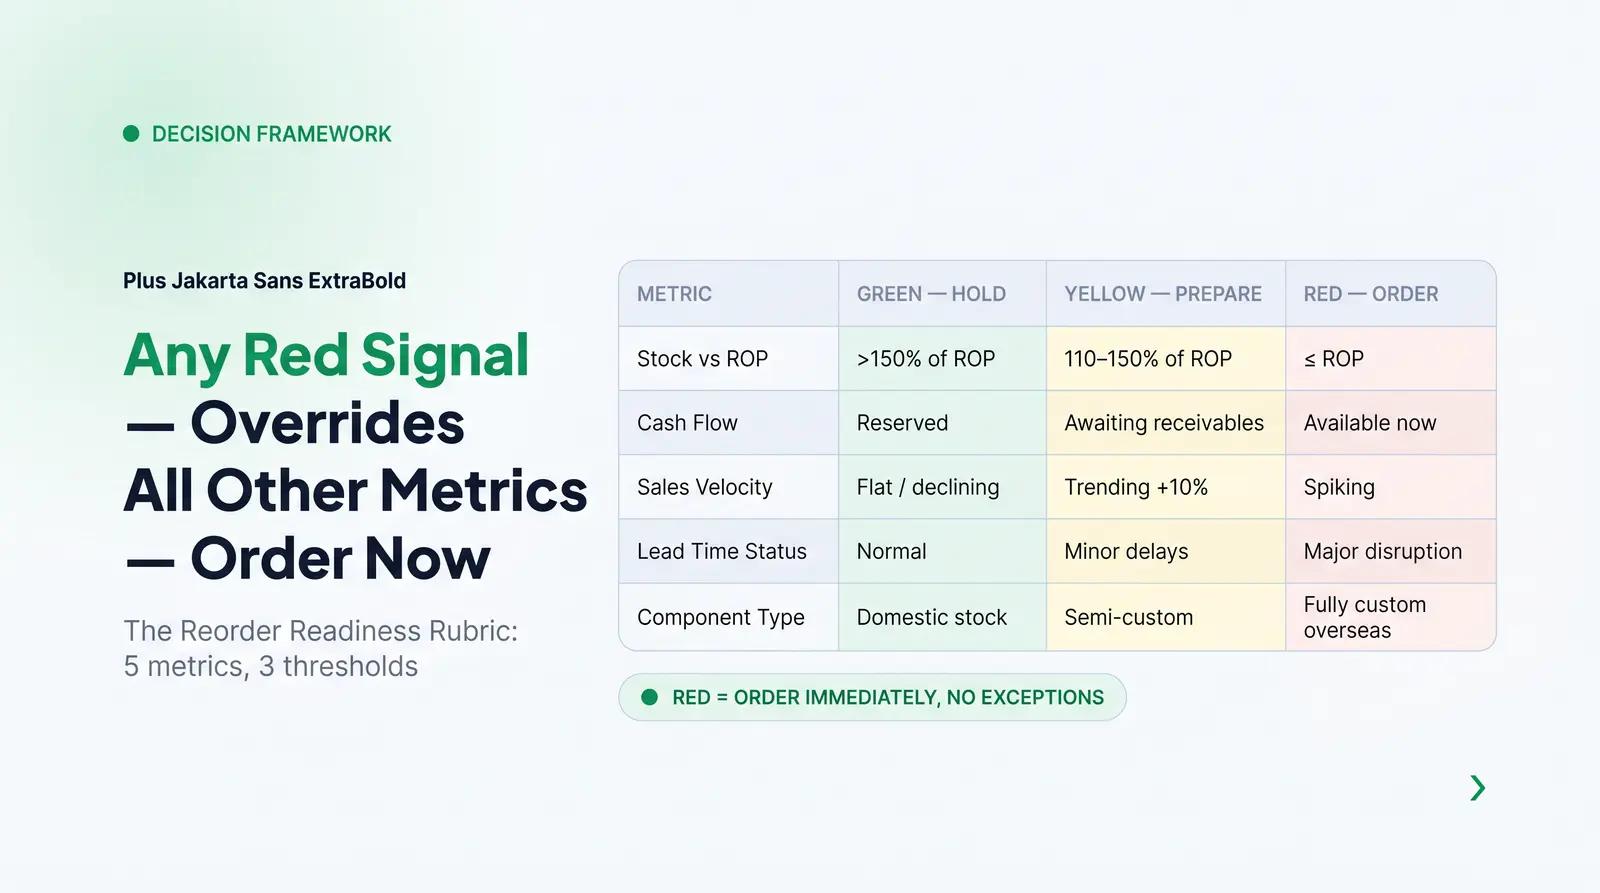
To simplify SKU-level decisions, we recommend a practical framework: The Packaging Reorder Readiness Rubric. This matrix helps founders assess whether to pull the trigger on a purchase order today or hold onto their cash.
| Assessment Metric | Green (Hold Off) | Yellow (Prepare) | Red (Order Now) |
|---|---|---|---|
| Current Stock vs. ROP | Inventory > 150% of ROP | Inventory at 110%–150% of ROP | Inventory ≤ ROP |
| Cash Flow Position | Cash reserved for next run | Awaiting receivables | Cash available now |
| Sales Velocity Trend | Flat or declining | Trending upward (10%+) | Spiking unexpectedly |
| Supplier Lead Time Status | Normal / Confirmed | Minor delays reported globally | Major port/factory disruptions |
| Component Type | Domestic stock item | Semi-custom / Hybrid | Fully custom overseas |
When evaluating a SKU, any metric in the "Red" column overrides the others. If inventory hits the ROP, the order must be placed regardless of cash flow discomfort, or a stockout is mathematically guaranteed.
MOQ Breaks and Cash-Flow Math
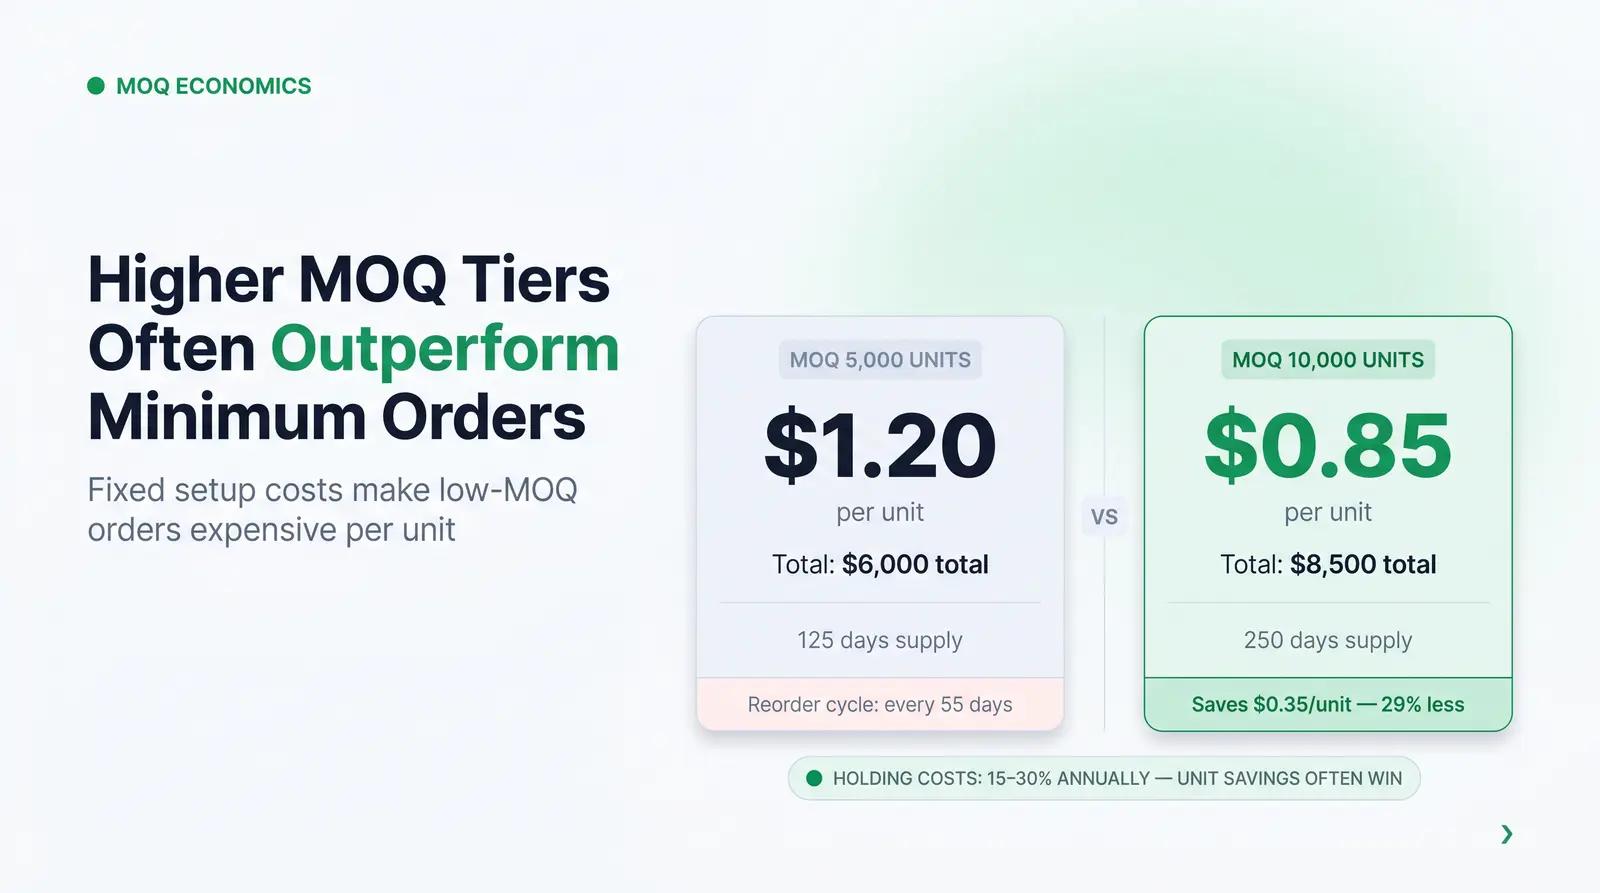
Minimum order quantities dictate the unit economics of cosmetic packaging [2]. A standard plastic jar might cost $1.50 at an MOQ of 5,000 units, but drop to $0.85 at 10,000 units. The instinct for a cash-strapped founder is to order the absolute minimum to preserve capital. However, this is often a trap.
There is a contrarian case for ordering at a higher MOQ tier earlier than demand strictly requires. For custom-printed packaging, the factory setup costs—tooling calibration, ink mixing, machine downtime—are fixed regardless of whether they run 5,000 or 20,000 units. By ordering the absolute minimum, a brand pays those fixed costs more frequently. Furthermore, the true cost of a stockout on a hero SKU includes lost revenue, damaged retail relationships, and the exorbitant premium required to air-freight emergency components. Inventory holding costs typically range from 15% to 30% of the inventory's value annually [5]. If moving to a higher MOQ tier reduces the unit cost by 40%, the savings heavily outweigh the holding costs, provided the SKU has proven, consistent demand.
Lead Time Reality by Component Type
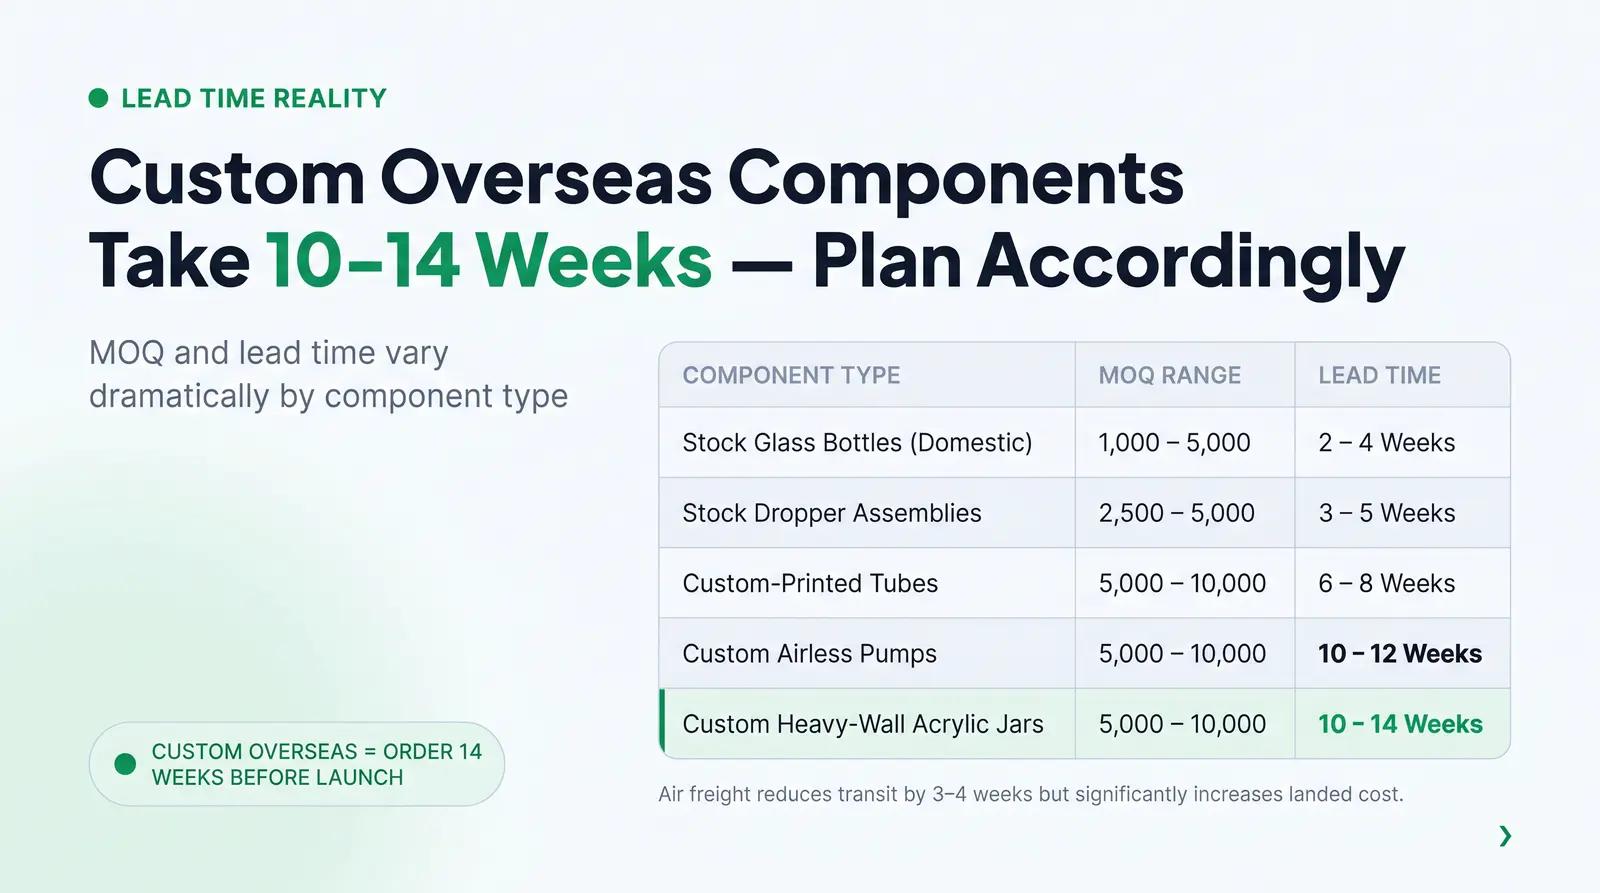
Not all packaging is created equal. The complexity of the component and the location of the manufacturer drastically alter the timeline. Below is a realistic look at standard lead times and MOQs for common cosmetic primary packaging.
| Packaging Component Type | Typical MOQ Range | Production + Transit Lead Time |
|---|---|---|
| Stock Glass Bottles (Domestic) | 1,000 – 5,000 | 2 – 4 Weeks |
| Custom-Printed Tubes | 5,000 – 10,000 | 6 – 8 Weeks |
| Custom Airless Pumps | 5,000 – 10,000 | 10 – 12 Weeks |
| Custom Heavy-Wall Acrylic Jars | 5,000 – 10,000 | 10 – 14 Weeks |
| Stock Dropper Assemblies | 2,500 – 5,000 | 3 – 5 Weeks |
Note: Lead times reflect standard overseas manufacturing with ocean freight. Air freight can reduce transit times by 3 to 4 weeks but significantly increases landed costs [1].
A Worked Example: The 1 oz Face Serum
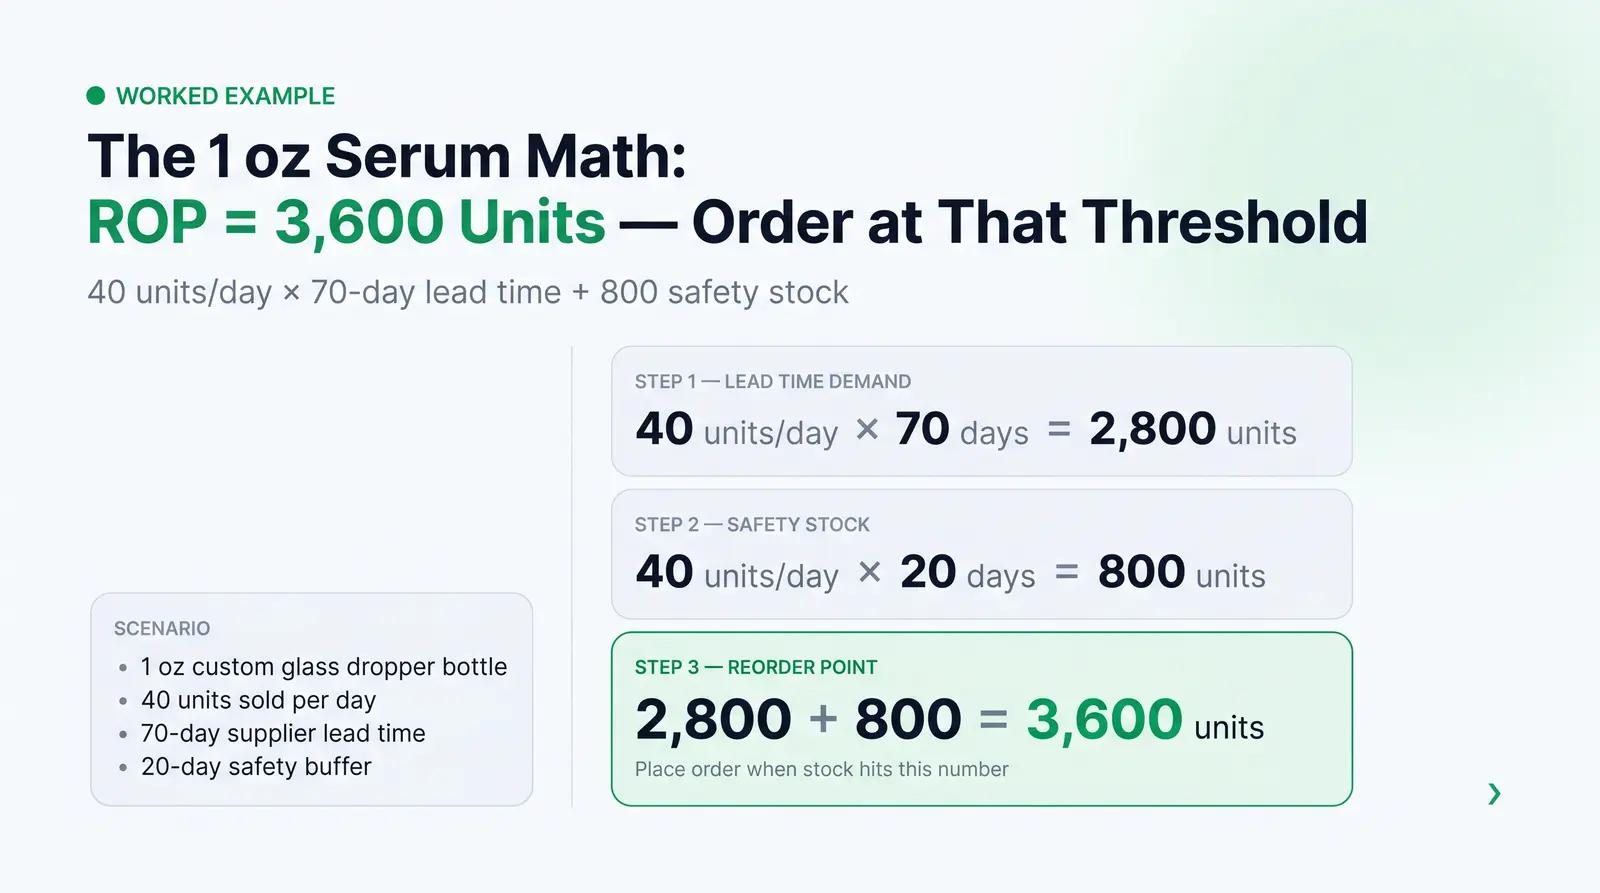
Consider a founder selling a 1 oz (30 ml) face serum in a custom-printed glass dropper bottle. The product sells an average of 40 units per day. The supplier requires a 10-week (70-day) lead time for production and ocean freight. The founder wants a 20-day safety stock buffer.
First, calculate the ROP:
- Lead Time Demand = 40 units/day × 70 days = 2,800 units
- Safety Stock = 40 units/day × 20 days = 800 units
- Reorder Point (ROP) = 3,600 units
When the physical inventory of empty dropper bottles drops to 3,600, the founder must place a new order.
Next, evaluate the MOQ cash-flow decision. The supplier offers 5,000 units at $1.20 each ($6,000 total) or 10,000 units at $0.85 each ($8,500 total). At 40 units a day, 5,000 units will last 125 days. Because the lead time is 70 days, the founder will hit the ROP for the next order just 55 days after the components arrive. This traps the founder in a constant, stressful reorder cycle, paying $1.20 per unit.
By spending an extra $2,500 upfront for the 10,000-unit tier, the founder secures 250 days of inventory, drops the unit cost by nearly 30%, and steps off the supply chain treadmill, freeing up mental bandwidth to focus on marketing.
SKU-Level Reorder Planning
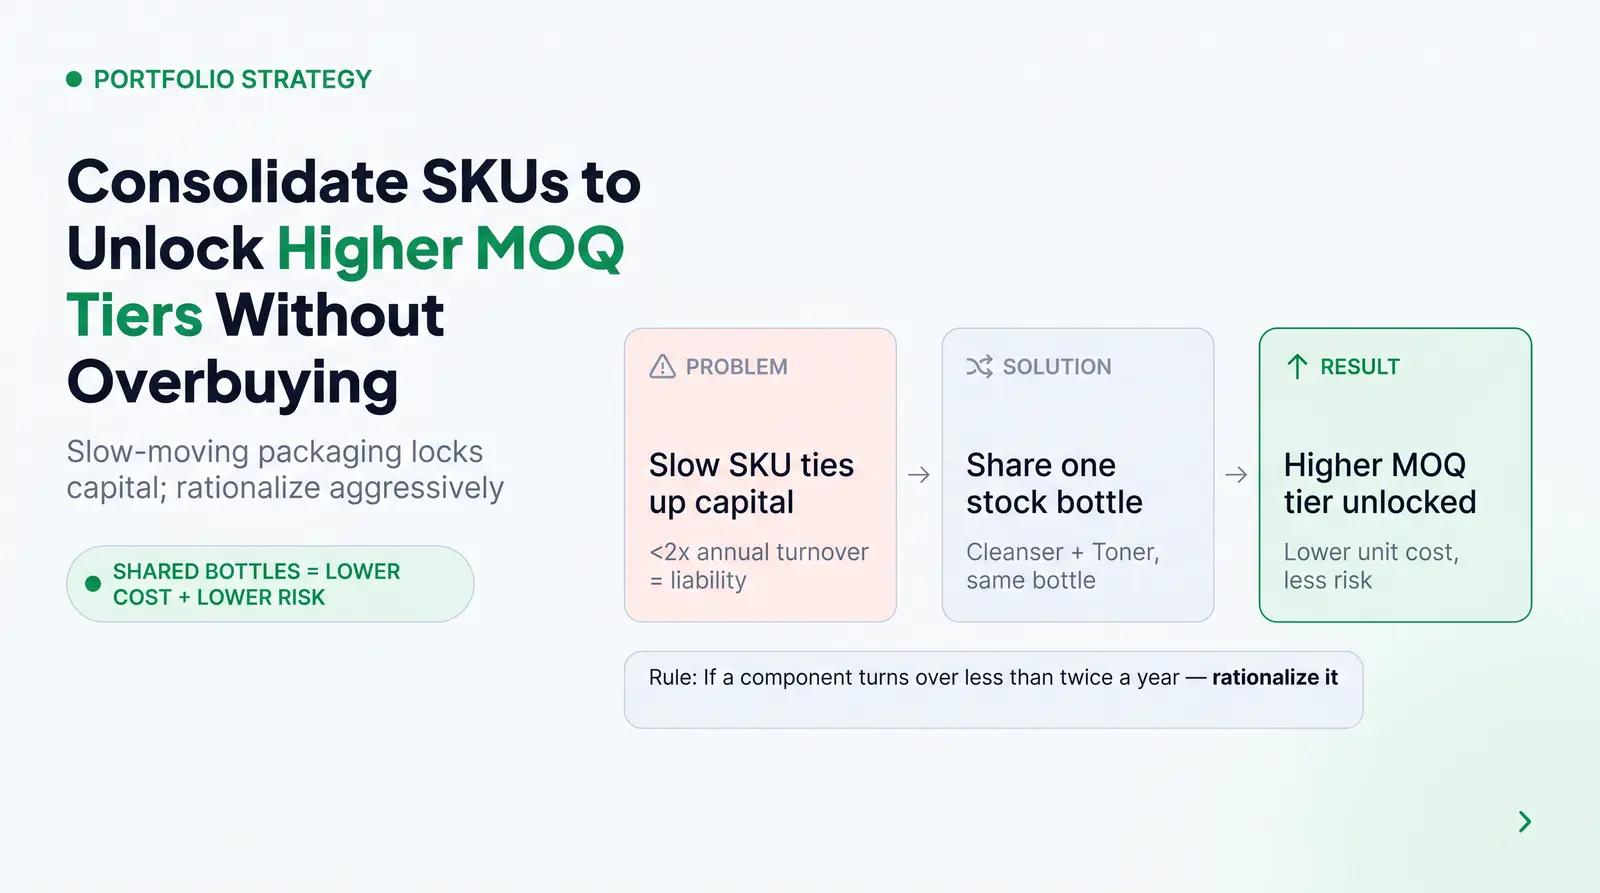
Managing a multi-SKU portfolio introduces the risk of capital starvation. If a brand over-orders packaging for a slow-moving SKU, that cash is locked in the warehouse, leaving nothing to fund the reorder of a fast-moving hero SKU.
Founders must practice aggressive SKU rationalization. If a component is tying up capital and turning over less than twice a year, it is a liability. Brands should look for opportunities to consolidate packaging. For example, using the exact same stock bottle for a cleanser and a toner, differentiated only by a custom label, allows the brand to hit higher MOQ tiers for the bottle while maintaining low inventory risk across both products.
Demand Signals Worth Tracking
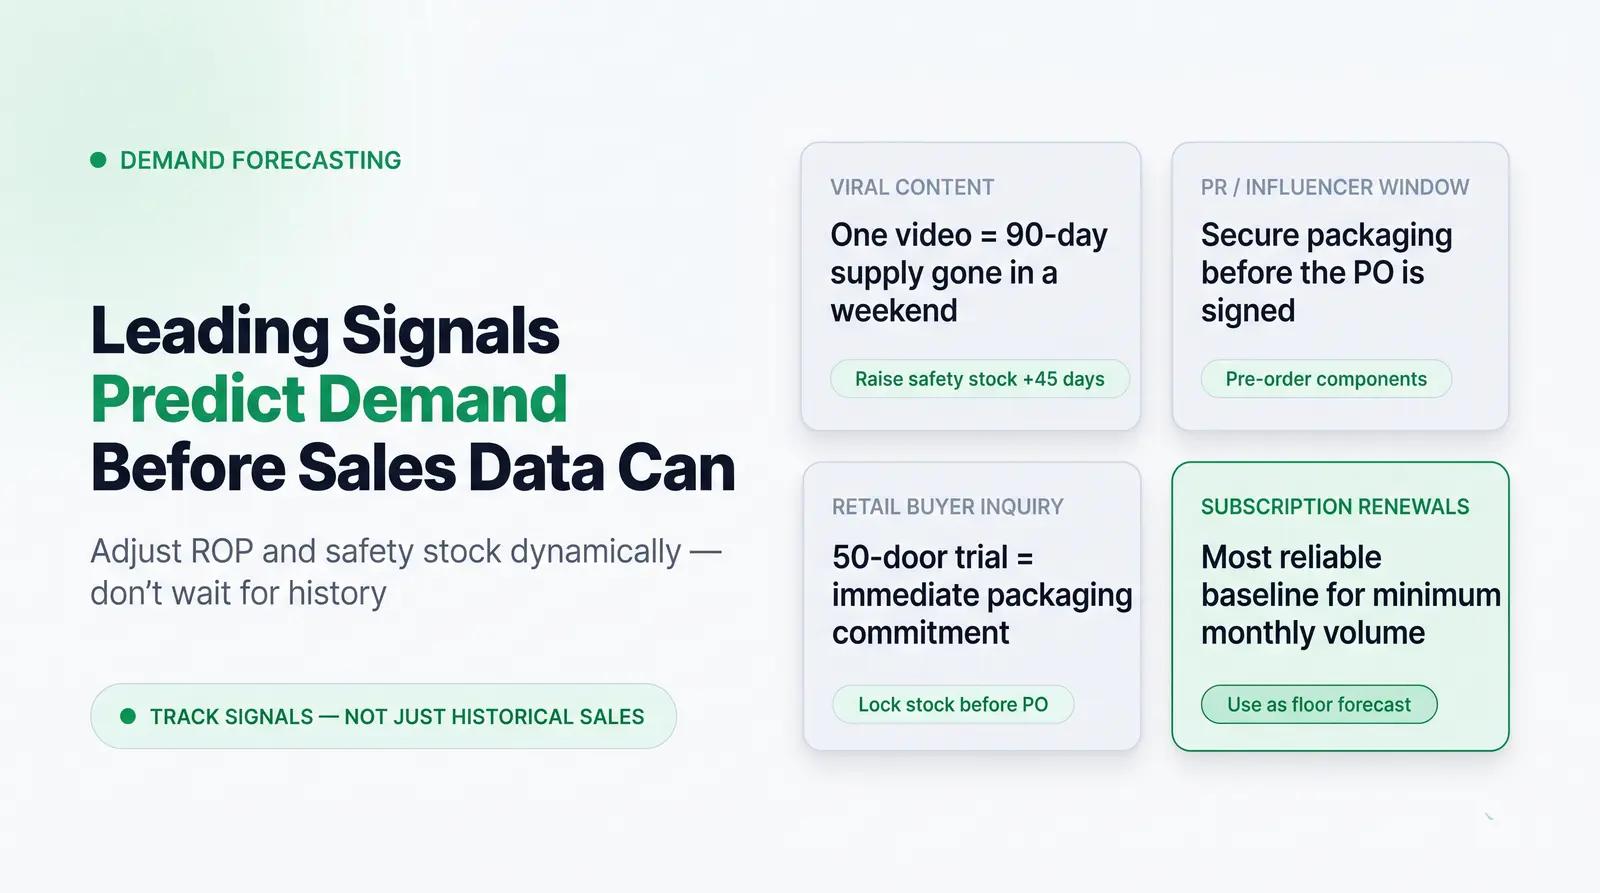
Relying solely on historical sales data to forecast packaging needs is dangerous in the beauty industry. Founders must track leading demand signals to adjust their ROP and safety stock dynamically.
A sudden spike in social proof, such as an organic viral video, can deplete a 90-day supply in a weekend. Similarly, upcoming PR coverage windows or planned influencer campaigns require temporary increases in safety stock. Retail buyer inquiries are another massive signal; if a buyer requests a trial run for 50 doors, the packaging must be secured before the purchase order is even finalized. Finally, for brands with recurring revenue models, tracking subscription renewal rates provides a highly accurate baseline for minimum monthly packaging consumption.
Managing these variables across multiple suppliers, negotiating MOQs, and tracking freight is exhausting. This is where modern infrastructure changes the game. Browse Packfolio's curated packaging catalog and preview your label in 3D before placing your next reorder → https://packfolio.com/catalog. By coordinating production and freight directly, founders can focus on building their brand rather than chasing factory updates.
Frequently Asked Questions
How do I calculate the reorder point for cosmetic packaging?
Multiply your average daily unit sales by the supplier's lead time in days, then add your safety stock. When your physical inventory drops to this calculated number, it is time to place a new purchase order.
What is a good safety stock level for beauty packaging?
A standard safety stock covers 15 to 30 days of average sales. However, if your supplier is overseas or prone to delays, increasing safety stock to 45 days provides better protection against stockouts.
How long does custom cosmetic packaging take to produce?
Custom-printed packaging manufactured overseas typically requires 10 to 14 weeks for production and ocean freight. Domestic stock packaging can often be secured in 2 to 4 weeks.
What is the minimum order quantity for cosmetic packaging?
While some domestic suppliers offer stock items at 1,000 units, custom-decorated cosmetic packaging usually requires an MOQ of 5,000 to 10,000 units per SKU to absorb factory setup costs.
How does MOQ affect packaging costs for small beauty brands?
Ordering at the lowest possible MOQ significantly increases the per-unit cost. Moving up to the next MOQ tier (e.g., from 5,000 to 10,000 units) can drop unit costs by 20% to 40%, which often outweighs the cost of holding the extra inventory.
References
[1] Paramount Global. "Your Guide to Supply Chain Lead Times." 2022. https://www.paramountglobal.com/knowledge/supply-chain-lead-time/
[2] Gidea Packaging. "Everything you need to know about Minimum Order Quantity in the cosmetic packaging industry." https://gideapac.com/everything-you-need-to-know-about-minimum-order-quantity-in-the-cosmetic-packaging-industry/
[3] GAINSystems. "Reorder Point vs. Safety Stock: Balancing Inventory in Retail." 2025. https://gainsystems.com/blog/reorder-point-vs-safety-stock-balancing-inventory-in-retail/
[4] Investopedia. "Economic Order Quantity (EOQ): Key Insights for Efficient Inventory Management." 2026. https://www.investopedia.com/terms/e/economicorderquantity.asp
[5] Finale Inventory. "Holding Cost: Complete Guide to Understanding and Calculating." 2025. https://www.finaleinventory.com/blog/guides/holding-cost/
[6] IHL Group. "Retail Inventory Crisis Persists Despite $172 Billion in Improvements." 2025. https://www.ihlservices.com/news/analyst-corner/2025/09/retail-inventory-crisis-persists-despite-172-billion-in-improvements/


